 Dianyang
1 / 2
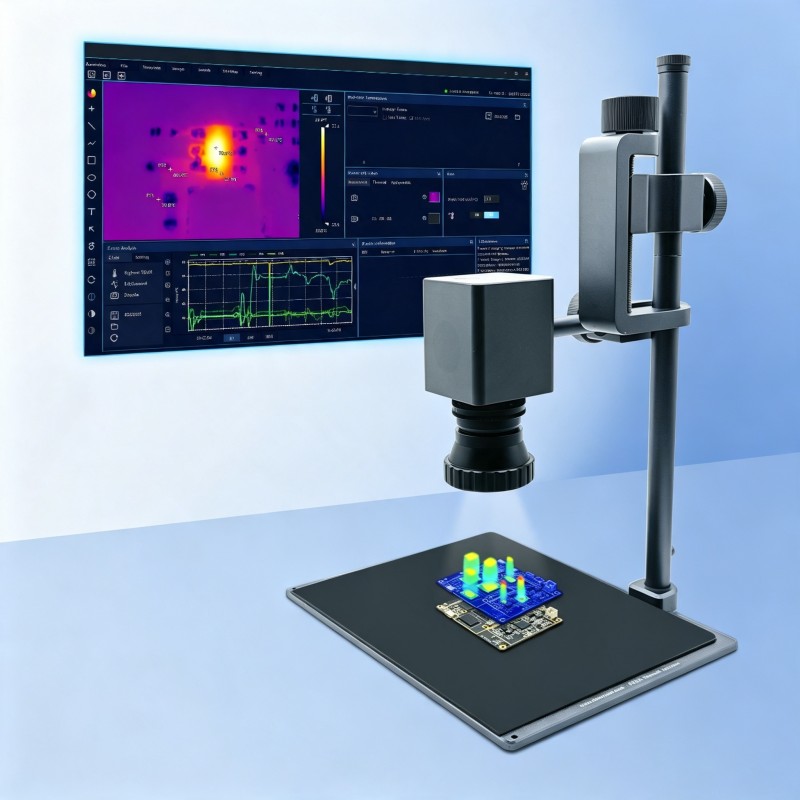
The CA‑60D relies on a full‑featured software platform to convert raw thermal readings into practically usable engineering insights. Connecting to a Windows‑based PC over USB, this software delivers an abundant set of analytical functions: real‑time and post‑recording video evaluation, temperature trend plotting, isotherm visualization, as well as point, line and polygon‑shaped measurement areas, alongside data export to Excel format. Operators are allowed to set up numerous measurement zones with separate emissivity parameters. This capability proves especially vital for assessing circuit boards integrating metallic traces, ceramic enclosures and plastic connectors on one single surface.
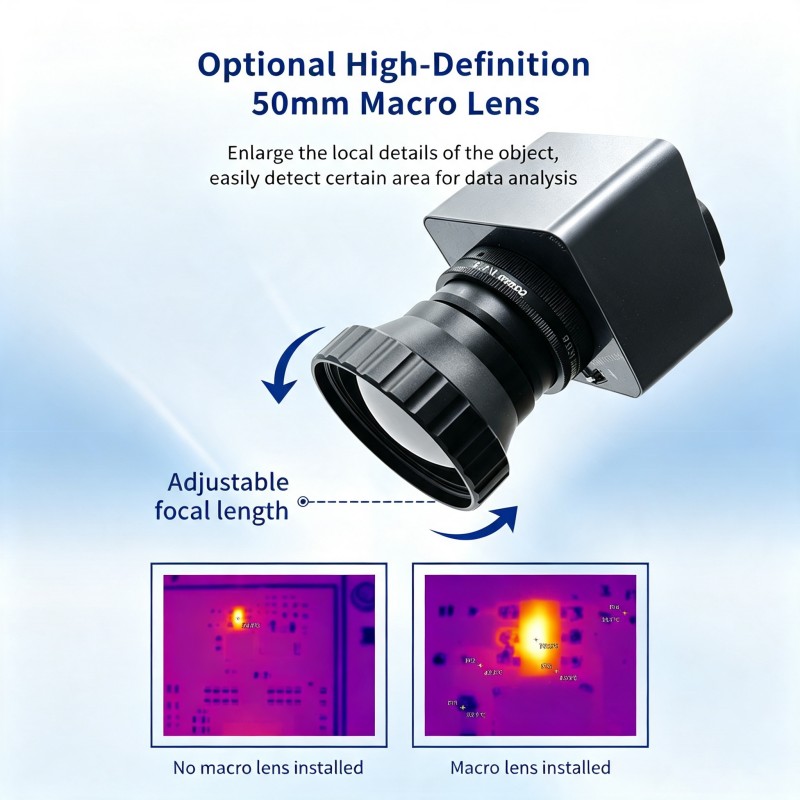
For scenarios where native resolution cannot meet the analysis demands of fine‑pitch electronic parts, the CA‑60D supports a special macro lens, which allows detection of targets down to 50 micrometers. Under this magnified view, discrete IC pins, wire bonds and micro‑vias can be observed through thermal imaging. This makes it feasible to investigate die‑level heat generation, verify the reliability of solder joints, and characterize thermal performance of tiny components including 0201‑format resistors and fine‑pitch QFN packages.
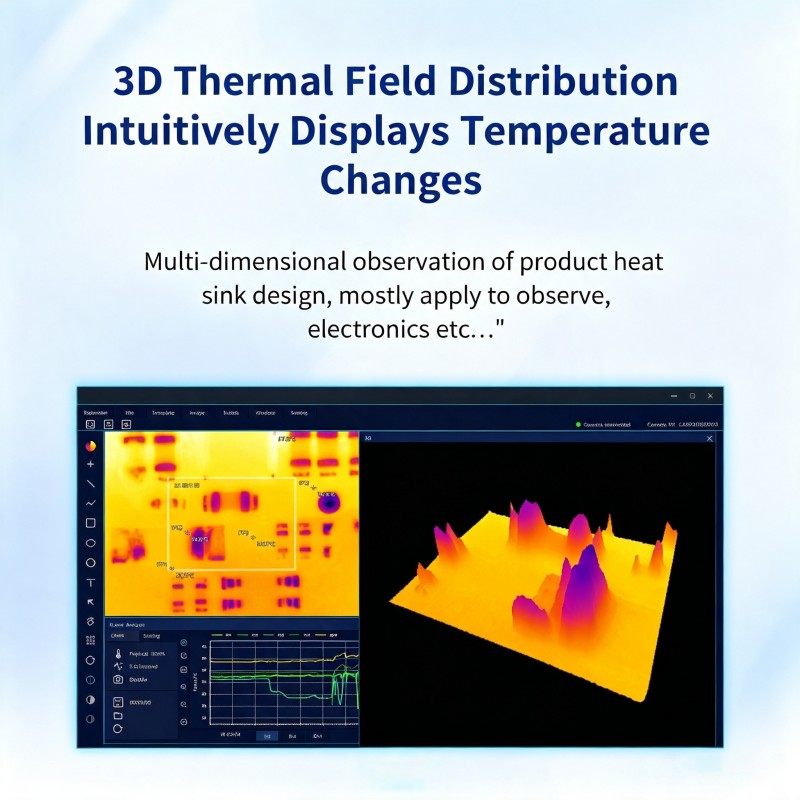
Going past conventional two‑dimensional thermal heatmaps, the CA‑60D generates an interactive 3D thermal field showing full‑board temperature distribution. This volumetric visual output instantly highlights overheating components, reveals how heat spreads across the PCB, and verifies whether thermal‑management hardware including heatsinks and copper pours work as designed. Engineers may rotate and magnify the 3D model to examine thermal gradients surrounding specific integrated circuits, capacitors and power regulation devices.
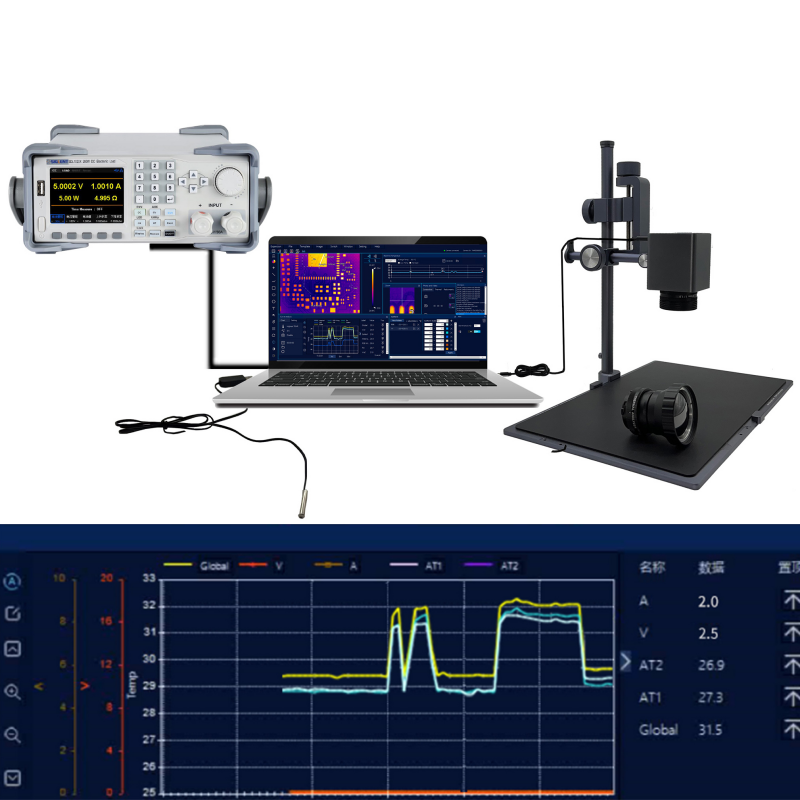
Thermal performance hardly occurs independently; it is governed by electrical loading, surrounding‑environment factors and material characteristics. To cope with such real‑world working conditions, the CA‑60D permits concurrent connection of external USB‑based sensors, among which are ambient temperature probes and load power monitors. Within the software, voltage, current and temperature traces are plotted along a unified time axis. This enables engineering staff to pinpoint cause‑and‑effect correlations, for instance local heat buildup induced by current surges, or measurement baseline shifts brought about by ambient temperature drift.
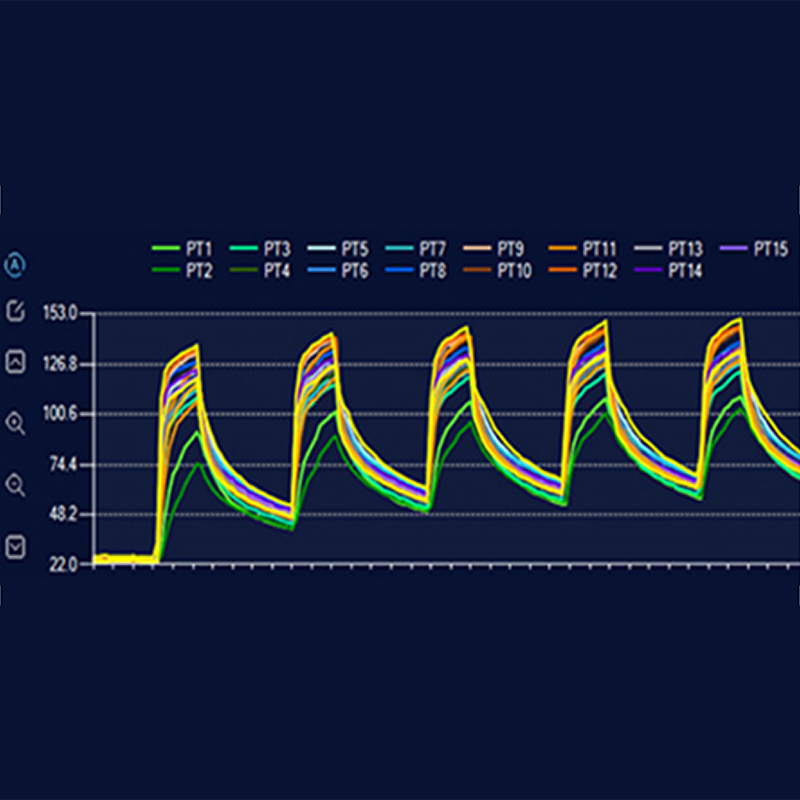
Boasting robust multi‑curve analysis functions, the CA‑60D Thermal Analyzer is capable of gathering temperature readings from measuring points, measuring lines and target regions at the same time. Multiple curve traces are rendered concurrently, delivering visual comparison and trend tracking for temperature variations across different objects. It supports fast assessment of thermal steady‑state conditions and heat fluctuations, and allows users to conduct high‑efficiency thermal‑performance evaluation for electronic components and heat‑dissipation materials.
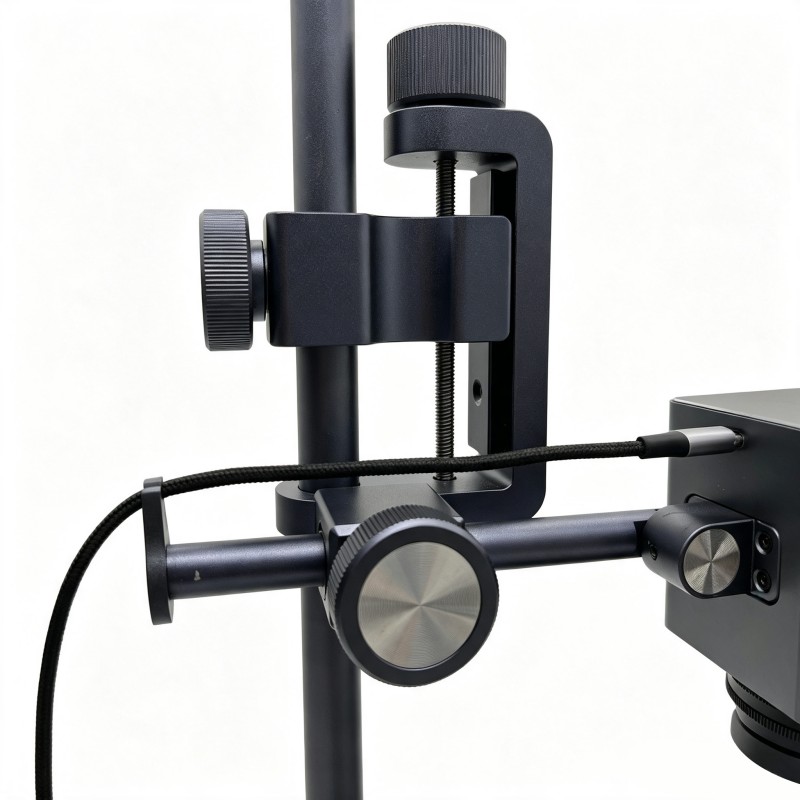
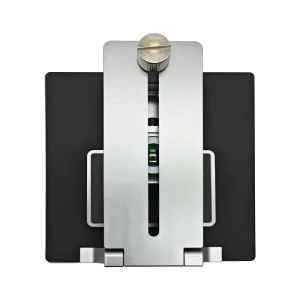
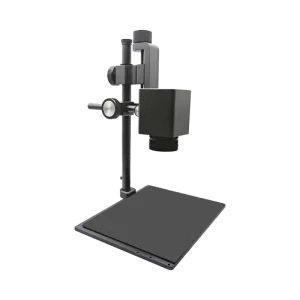
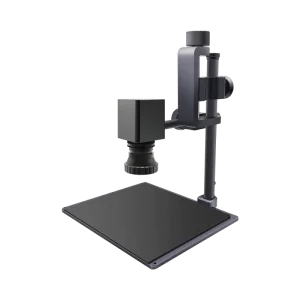
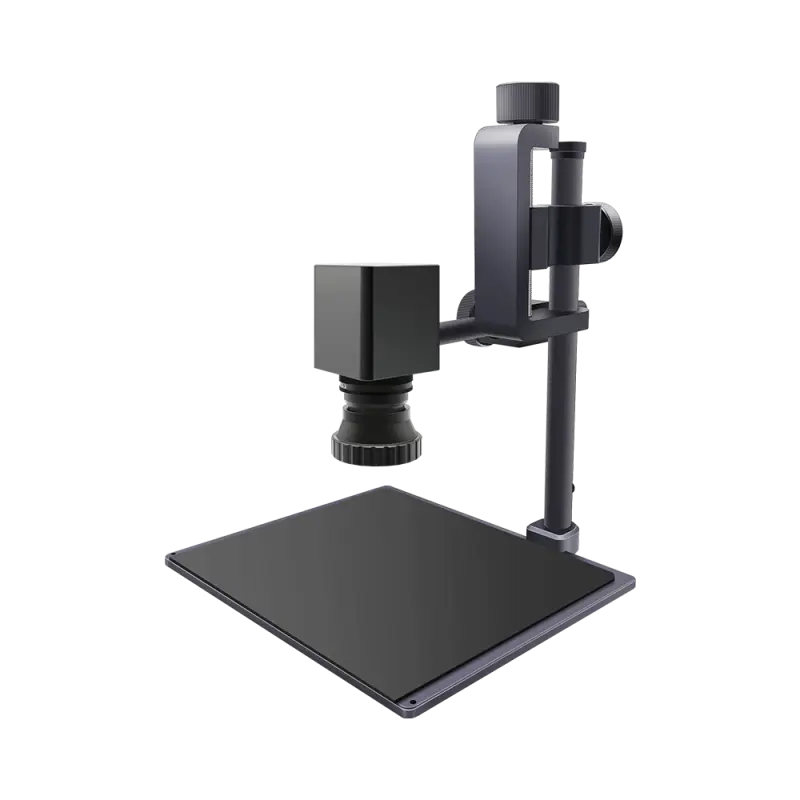
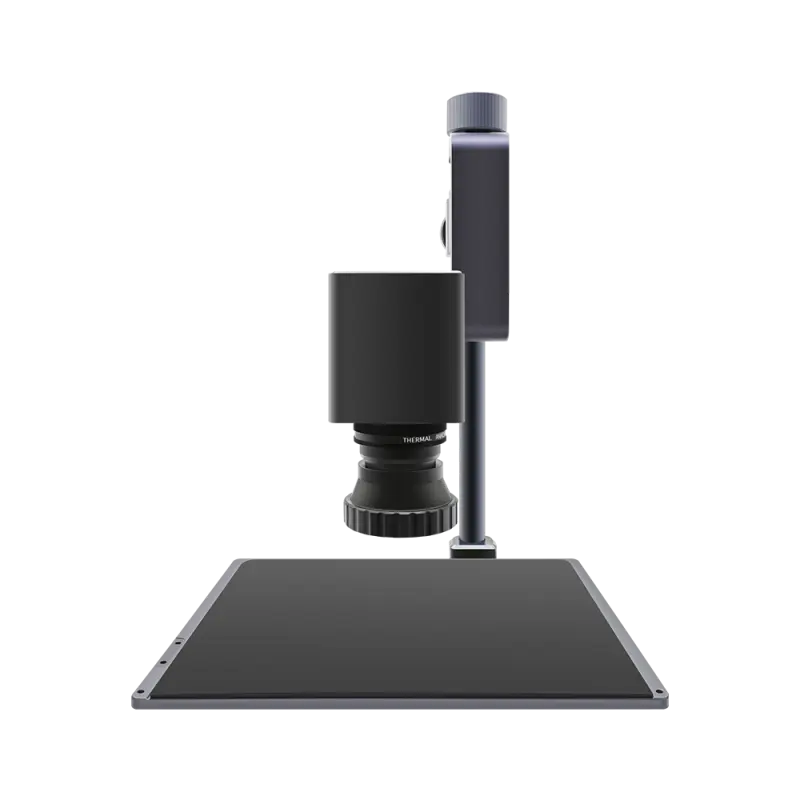
Accurate thermal characterization demands mechanical rigidity and versatile positioning options. The CA‑60D pairs with a heavy‑duty multi‑axis adjustment stand, which lets users position the sensor module at nearly any angle toward the specimen under test. Manual focusing enables precise sharpness tuning across working distances ranging from 40 mm up to 2000 mm.
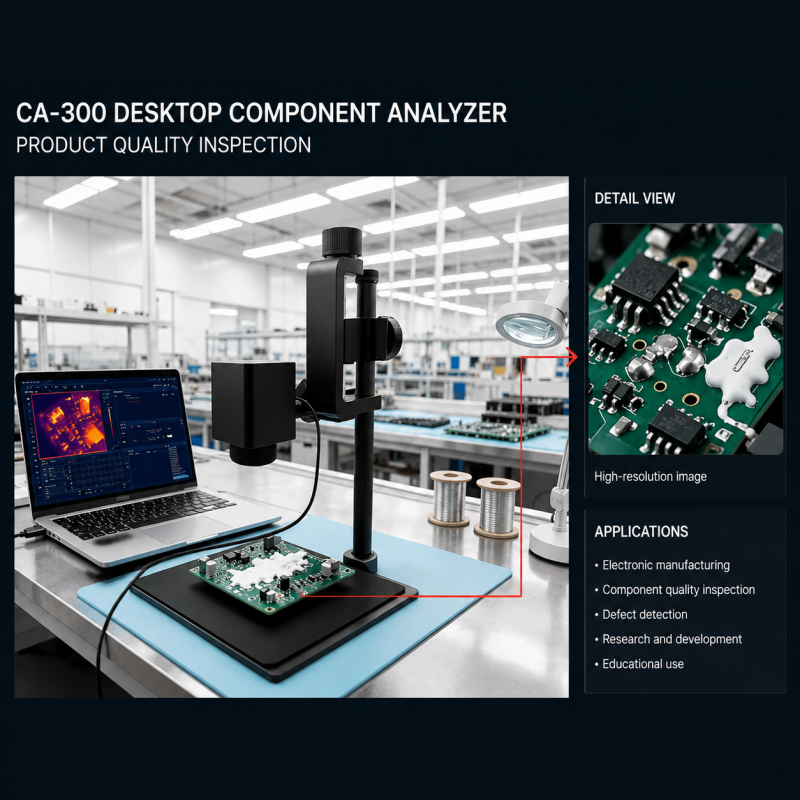
Coupled with the 9.1 mm standard optic, the 640×512 detector delivers highly‑detailed thermal imagery capable of resolving separate IC package pins as well as nearby thermal signatures. Such image sharpness is indispensable for troubleshooting faults including cold solder connections, BGA components suffering from internal delamination, and power MOSFETs operating above their rated thermal limits.
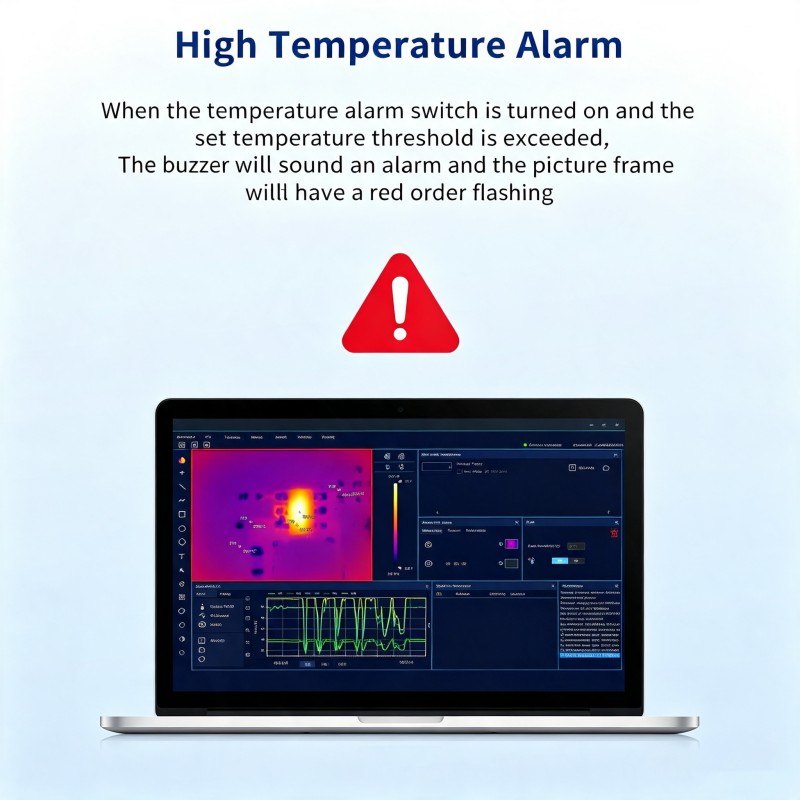
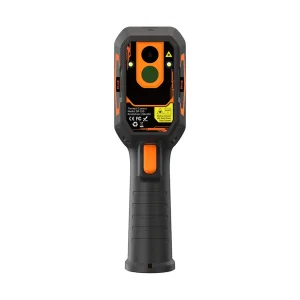
The CA‑60D Thermal Analyzer comes with a highly useful over‑temperature warning feature. Once users activate the temperature alarm setting, the buzzer will trigger an acoustic alert if measured temperature goes beyond the preconfigured threshold. Simultaneously, a red flashing border appears around the target zone on‑screen. Thanks to this combined sound‑and‑visual warning system, the unit quickly detects unexpected temperature surges. It assists technicians in catching potential over‑heating hazards promptly and delivers enhanced safety and dependability throughout thermal‑testing procedures.
| Parameter | Value |
|---|---|
| IR Resolution | 640 × 512 pixels |
| Spectral Range | 8 ~ 14 μm |
| Thermal Sensitivity (NETD) | < 50 mK @ 25°C |
| Field of View | 48.7° (H) × 38.6° (V) |
| IFOV | 1.3 mrad |
| Frame Rate | 25 Hz |
| Focus | Manual |
| Measurement Range | -20°C ~ 550°C |
| Measurement Accuracy | -20~120°C: ±2°C/±2% -120~550°C: ±3°C/±3% |
| Measurement Modes | Max, min, average |
| Optimal Distance | 4 ~ 200 cm |
| Macro Lens (Optional) | 60 ~ 100 mm (detects 25μm) |
| Emissivity | 0.1 ~ 1.0 (adjustable) |
| Image File | Full radiometric JPG |
| Radiometric Recording | .dyv (analysis software) |
| Min Sampling Interval | 40 ms |
| Operating Temperature | -10°C ~ +55°C |
| External Devices | USB temp sensor, USB power meter |
| Software Functions | Temp curves, isothermal lines, 3D thermal field, point/line/polygon measurement, temp alarms, Excel export, full radiometric video |
The CA-60D features a high-definition infrared detector with a resolution of 640 × 512 pixels and a thermal sensitivity (NETD) of < 50 mK @ 25°C, operating at a 25 Hz frame rate for precise thermal inspection.
Yes, with the optional macro lens, the analyzer supports target detection down to 50 micrometers (and close-up target detection down to 25μm), allowing clear observation of discrete IC package pins, wire bonds, and micro-vias.
When a measured temperature exceeds the preset threshold, the system triggers an acoustic buzzer alert along with a red flashing border around the target zone on-screen for instant visual and sound alerts.
Yes, the CA-60D software allows concurrent connection of USB-based external sensors such as ambient temperature probes and load power monitors, plotting voltage, current, and temperature on a synchronized timeline.
The device captures full radiometric JPG images and .dyv radiometric video files. The software supports temperature curves, 3D thermal field displays, isothermal lines, point/line/polygon area tools, and Excel data export.